A market research platform, 14.5 months with one client

A market research company publishes ETF and stock research for its readers. I’ve worked on its platform since August 2025, from the price loaders and the database to the dashboards, the nightly research charts and the email that lands each morning.
One market research platform, end to endA system map. Top row, left to right. 29 price and holdings sources feed nightly loaders, which write to PostgreSQL. A Django REST API reads it, and React dashboards with Chart.js and Plotly show it. Bottom row, the database also feeds 342 research scripts that the client’s analysts write in Python, which render charts with Matplotlib and send them as email reports. Three numbered fixes are marked. One, between the API and the dashboards, a page that made more than 3,800 API requests per load now makes 3. Two, on the charts, 30 of 75 nightly charts were blank on 26 October, and 0 after the fix. Three, on the email reports, scheduled reports that had been stuck for 72 days run again. Along the bottom, AWS ECS Fargate, Terraform Cloud, 18 GitHub Actions workflows and 948 backend tests.One platform, from raw prices to the reader’s inbox14.5 months, under NDA[1] Data in[2] Research outSources29 price feedsLoadersnightly schedulePostgreSQLAWS RDSREST APIDjango, JWTDashboardsReact, Chart.jsAnalystswrite the researchScripts342, in PythonChartsMatplotlibEmail reportsAWS SES13,800 API requests per pagecut to 3230 of 75 charts blank,then 03stuck 72 days,now on timeAWS ECS FargateTerraform Cloud, 20 files18 GitHub Actions workflows948 backend testsOne market research platform, end to endA system map. Top row, left to right. 29 price and holdings sources feed nightly loaders, which write to PostgreSQL. A Django REST API reads it, and React dashboards with Chart.js and Plotly show it. Bottom row, the database also feeds 342 research scripts that the client’s analysts write in Python, which render charts with Matplotlib and send them as email reports. Three numbered fixes are marked. One, between the API and the dashboards, a page that made more than 3,800 API requests per load now makes 3. Two, on the charts, 30 of 75 nightly charts were blank on 26 October, and 0 after the fix. Three, on the email reports, scheduled reports that had been stuck for 72 days run again. Along the bottom, AWS ECS Fargate, Terraform Cloud, 18 GitHub Actions workflows and 948 backend tests.Raw prices to the reader’s inboxSources29 price feedsLoadersnightly schedulePostgreSQLAWS RDSREST APIDjango, JWT13,800 requests per page, cut to 3DashboardsReact, Chart.jsScripts342, in PythonChartsMatplotlib230 of 75 blank, then 0Email reportsAWS SES3stuck 72 days, now on time
I own the whole path, from the price loaders to the email that lands at 7 in the morning. The numbered marks are three of the fixes, each measured before and after.
14.5Months with this client
19Numbered sprints so far
3API requests per page, was 3,800
948Backend tests, was 933
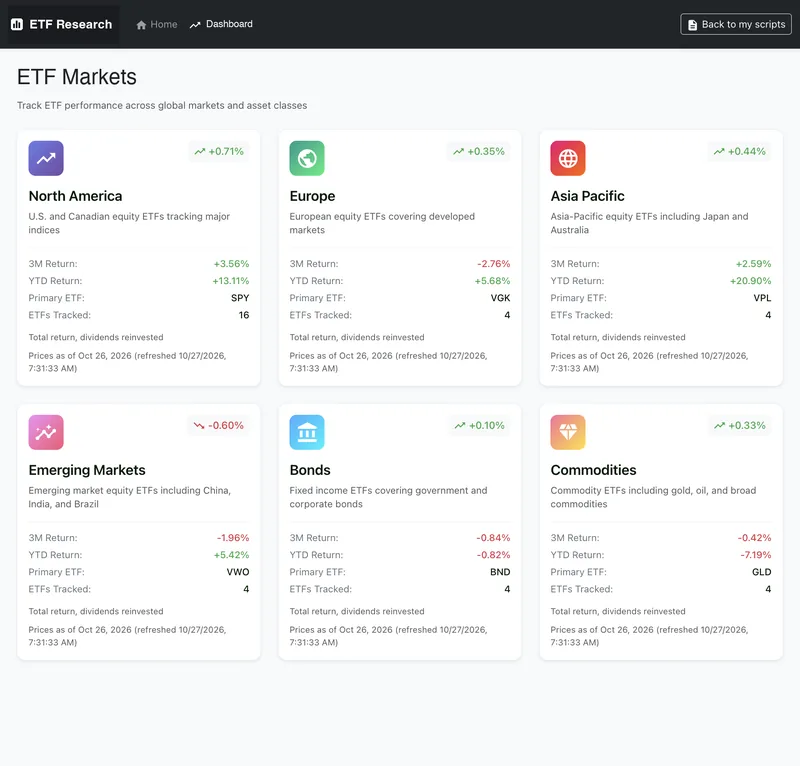
The ETF markets dashboard with six category cards, North America, Europe, Asia Pacific, Emerging Markets, Bonds and Commodities, each with 3 month and year to date returns
The ETF dashboard. Six categories, returns with dividends reinvested, prices refreshed every night.
14.5 months with one clientHourly work from August 2025, then 19 numbered sprints from March 2026, under a direct contract since late April. A timeline on one linear time scale from 18 August 2025 to 5 November 2026. A grey band for the hourly work, 18 August 2025 to 16 March 2026. Then the sprints on an accent axis. Sprint 1 is a short span from 17 March to 8 May, part time. Sprints 2 to 19 are ticks, close together in May, when sprints 2 to 6 started within two weeks, and about two weeks apart from July. Two short add-ons in September and October are lighter ticks. A marker on 27 April shows the direct contract. Five milestones hang off the axis as cards. Sprint 5 in May, scheduled reports run again after 72 days stuck. Sprint 11 in July, a page that made 3,800 API requests per load now makes 3. Sprint 12 in July, 24 ETFs audited against raw prices with 0 made-up values. Sprint 16 in September, 29 of 29 data sources load in one run. Sprint 19, 26 October to 2 November, 0 blank nightly charts after 30 of 75.14.5 months, one client, sprint by sprintAug 2025 to Nov 2026Aug 2025NovFeb 2026MayAugNovhourly work, 7 months19 numbered sprintsdirect contractSprint 5Reports run againafter 72 days stuckSprint 113,800 requestsper page, cut to 3Sprint 1224 ETFs audited0 made-up valuesSprint 1629 of 29 sourcesload in one runSprint 190 blank chartsafter 30 of 75 14.5 months with one clientHourly work from August 2025, then 19 numbered sprints from March 2026, under a direct contract since late April. A timeline on one linear time scale from 18 August 2025 to 5 November 2026. A grey band for the hourly work, 18 August 2025 to 16 March 2026. Then the sprints on an accent axis. Sprint 1 is a short span from 17 March to 8 May, part time. Sprints 2 to 19 are ticks, close together in May, when sprints 2 to 6 started within two weeks, and about two weeks apart from July. Two short add-ons in September and October are lighter ticks. A marker on 27 April shows the direct contract. Five milestones hang off the axis as cards. Sprint 5 in May, scheduled reports run again after 72 days stuck. Sprint 11 in July, a page that made 3,800 API requests per load now makes 3. Sprint 12 in July, 24 ETFs audited against raw prices with 0 made-up values. Sprint 16 in September, 29 of 29 data sources load in one run. Sprint 19, 26 October to 2 November, 0 blank nightly charts after 30 of 75.14.5 months, one clientAug 2025SepOctNovDecJan 2026FebMarAprMayJunJulAugSepOctNovhourly work, 7 months19 numbered sprintsdirect contractSprint 5, reports run againafter 72 days stuckSprint 11, 3,800 requestsper page, cut to 3Sprint 12, 24 ETFs audited0 made-up valuesSprint 16, 29 of 29 sourcesload in one runSprint 19, 0 blank chartsafter 30 of 75
Hourly work from August 2025, then 19 numbered sprints from March 2026, under a direct contract since late April.
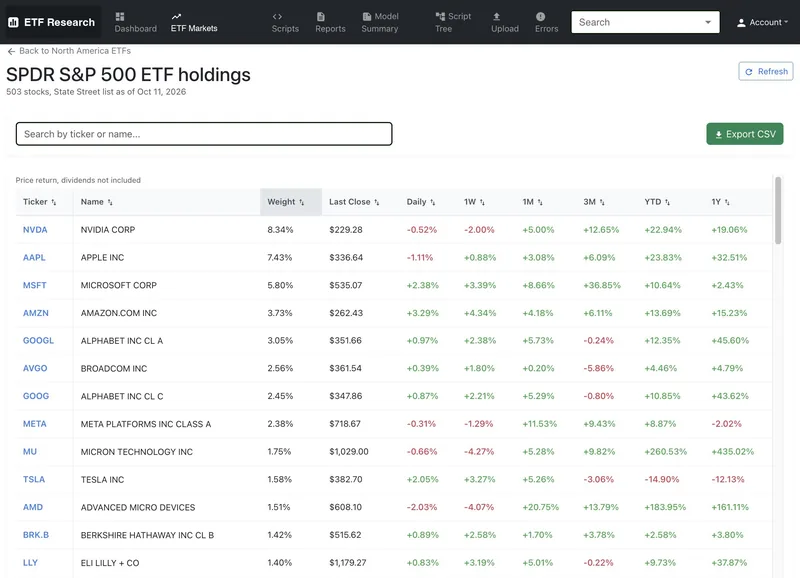
The holdings drill-down for an S&P 500 ETF, 503 stocks with weight, last close and returns from one day to one year, with search and CSV export
Holdings for 503 stocks with server-side paging, sorting, search and CSV export.
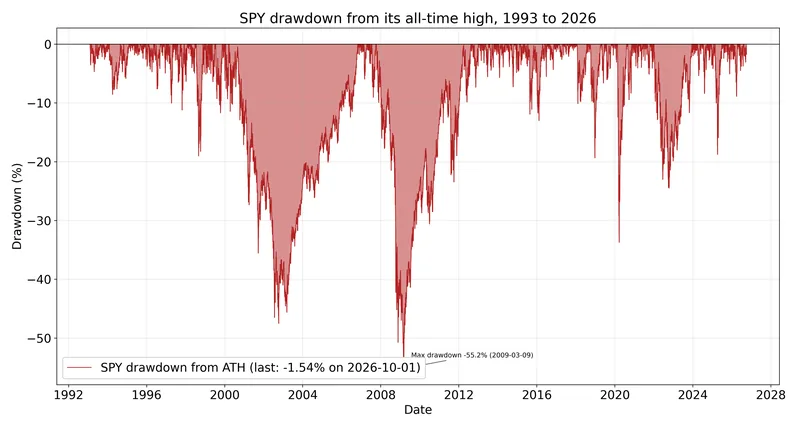
A nightly research chart of the SPY drawdown from its all-time high since 1993, with the 55.2 percent low of March 2009 marked
One of the nightly research charts, SPY’s distance from its high since 1993. In October 30 of 75 nightly charts came out blank. After the fix, none.
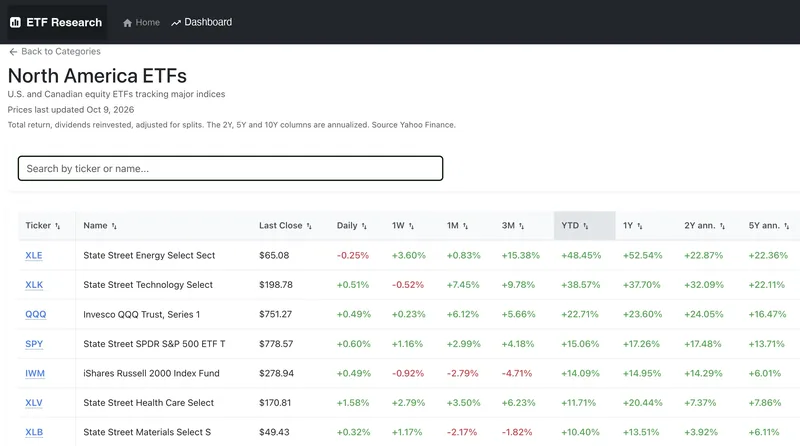
The North America ETF table with funds sorted by year to date return, from daily returns to 5 year annualized
The North America table. 16 funds, returns with dividends reinvested, sortable and searchable.
Year
2025 to 2026
Sector
Investment research
Client or project
Long-term client, under NDA
Duration
Since August 2025, 19 sprints
Stack
React, TypeScript, Chart.js, Django REST, PostgreSQL, AWS ECS and RDS, Terraform
Role
Full-stack engineer, from data loaders to the email reports
Updated

The client

A research company that publishes ETF and stock analysis. Readers get dashboards, holdings tables and a daily email card, and the company’s analysts write their own research in Python on the same platform.

I started in August 2025 on hourly work. Since March 2026 the work runs in numbered sprints, each with a written scope and one report at the end, under a direct contract since late April. Sprint 19 closed on 2 November and the next one is planned.

What I own

The whole path. Nightly loaders pull prices and fund holdings from 29 sources into PostgreSQL. A Django REST API serves them to a React app with Chart.js and Plotly. 342 research scripts run every night, render charts with Matplotlib and go out as email reports through AWS SES.

It runs on AWS ECS Fargate and RDS, with all infrastructure in Terraform Cloud and 18 GitHub Actions workflows for tests and deploys.

Three fixes, measured

Scheduled reports had been stuck for 72 days when I found the cause. They run on time again.

The reports page froze because one page load made more than 3,800 API requests. It now makes 3.

On 26 October, 30 of 75 nightly charts came out blank. Several threads shared one Matplotlib state. After the fix, 0 of 94 and then 0 of 88 were blank.

Data a reader can trust

I rebuilt 24 ETF cards from raw prices in a clean room and compared every figure. None was made up, and the 10 year annualized returns matched to 0.035 percentage points on average.

Holdings tables went from 600 to 1,800 rows with server-side paging, sorting and search, and one page now weighs about 6 KB compressed.

How the sprints run

Every sprint starts with a written scope and ends with one written report and an invoice by hours. Tests grow with the code, backend from 933 to 948 and front end from 152 to 185.

Security work rides along. API keys moved out of the task environment into AWS Secrets Manager, and the database password and app secret were rotated through Terraform.

The client’s name is withheld under an NDA. The screens are anonymized, and every number on them is public market data.

[+]More case studies

More case studies

All case studies

Next step

Send me your project, or the part your team can’t get to.

Send me your project

My last client result, a reports page cut from 3,800 requests per load to 3. The brief and the repo are enough to start.

How it starts

  1. [1]Send your project
  2. [2]Get a free plan
  3. [3]Approve the first milestone